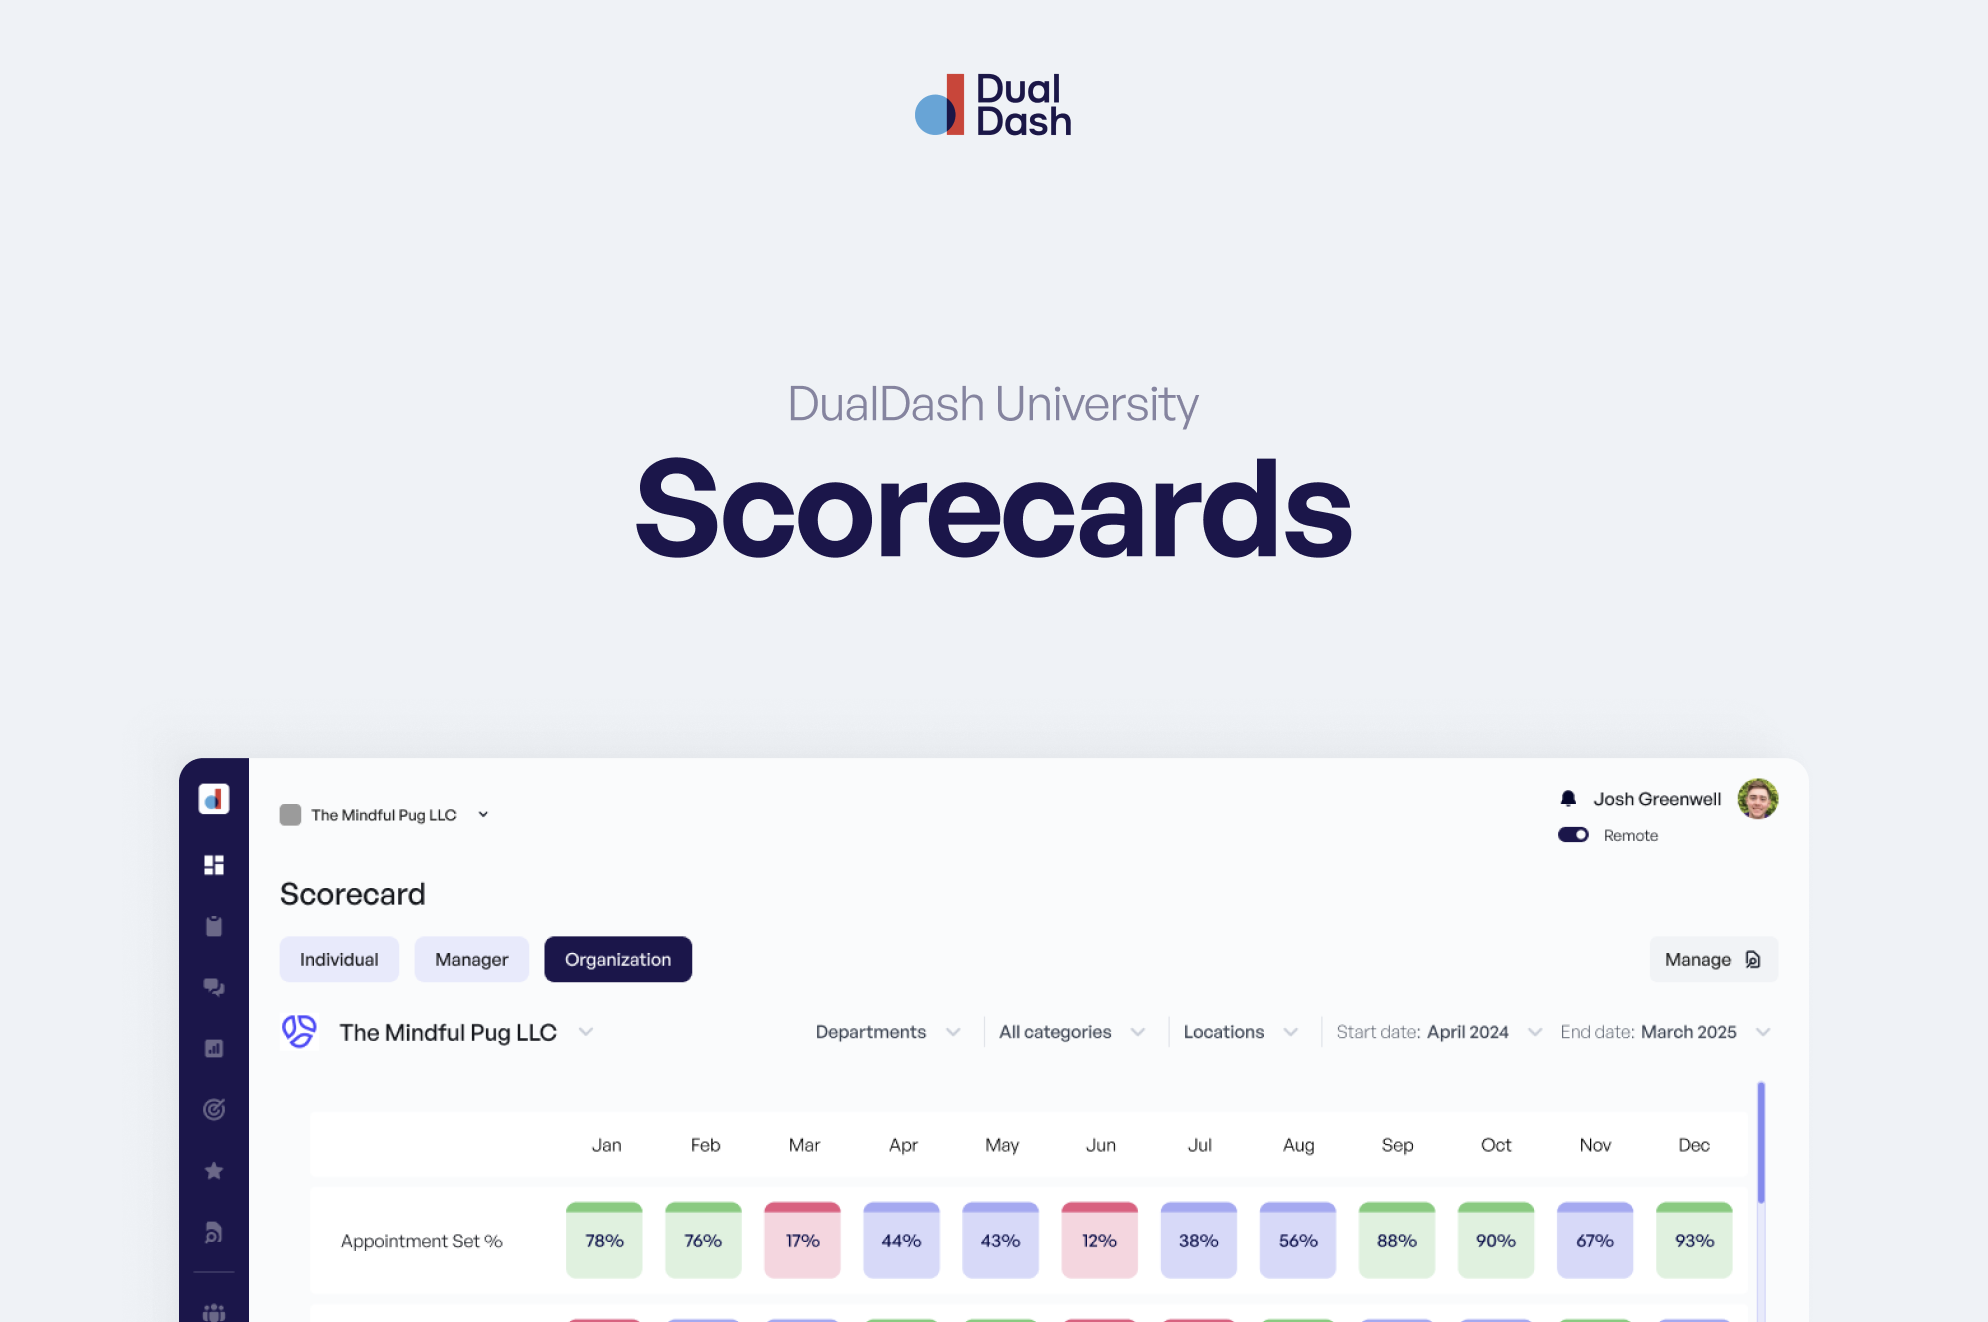
Keeping performance clear
Scorecards help teams see performance clearly.
They bring all of your KPIs into one place so you can quickly understand how results are trending and where attention may be needed.
The structure of a Scorecard
Each Scorecard has three main sections.
The Strike Zone
At the top of the Scorecard is the Strike Zone.
This section displays all of the KPIs connected to the Scorecard.
Each KPI is color coded based on how the result compares to its benchmark. This allows you to quickly see which metrics are performing well and which may need attention.
If a stripe appears at the top of the card, it means the current month is still in progress and not all data has been collected yet.
This helps prevent confusion when results appear incomplete.
The Strike Zone is designed to give you a fast, clear view of performance so you know where to focus.
KPI Trend Chart
Below the Strike Zone is the trend chart.
Clicking on any KPI row in the Strike Zone will update the chart to show the performance trend for that specific KPI.
You can also change the date range to expand the chart and review results over a longer period of time.
This helps teams identify:
- Patterns over time
- Momentum in performance
- Early signs of improvement or decline
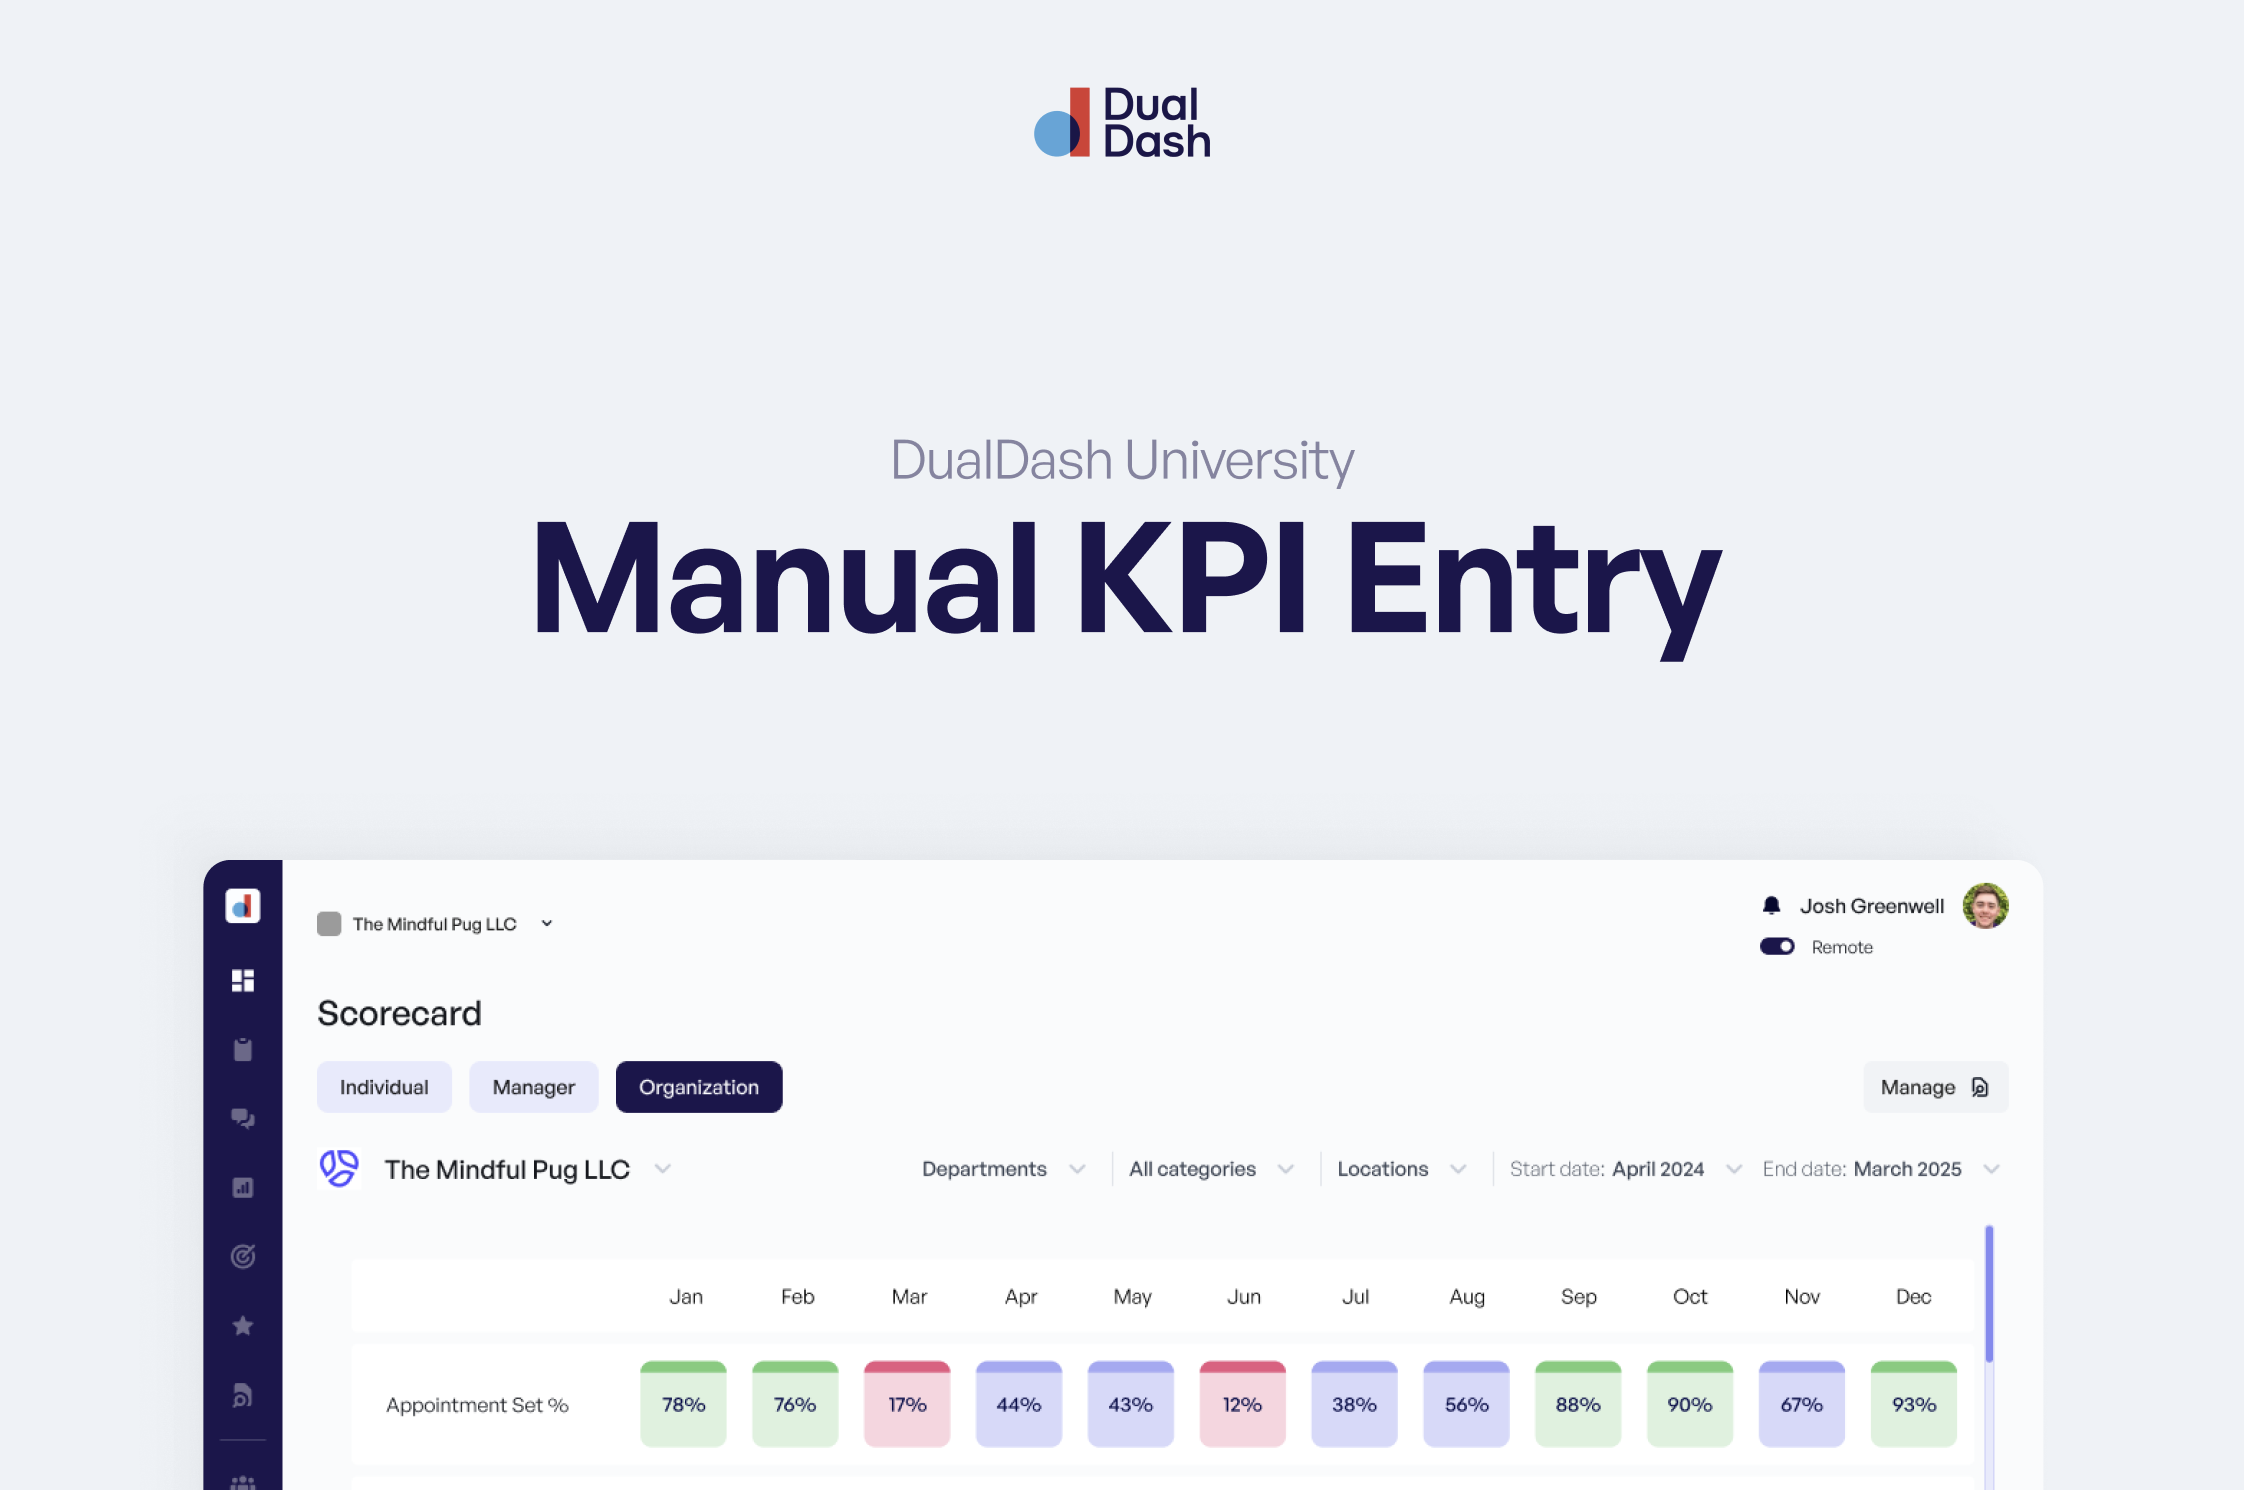
Updating actual results
The bottom table is where manual KPI updates happen.
If a KPI requires manual input, you can update the Actuals in this section.
A few things to know:
- If a KPI does not have a value yet, the slider should remain off (null)
- The default state for a KPI without data is null, not zero
- Enter 0 only if the actual value is truly zero
Benchmarks in the table are color coded, making it easier to see how results compare to expectations.
Totals are automatically calculated based on the data entered.
Adding context to the numbers
Numbers show what is happening. Context explains why.
From a KPI, you can:
- Add notes to explain changes in performance
- Capture challenges, wins, or external factors
- Add the KPI directly to a 1:1 agenda for discussion
This ensures performance is not just tracked, but understood.
Using Scorecards in conversations
Scorecards are designed to guide conversations, not replace them.
Teams often review Scorecards during 1:1 meetings to:
- Celebrate strong performance
- Discuss changes in results
- Identify opportunities for improvement
When results are clear, coaching becomes easier and more consistent.
Staying consistent
To get the most value from Scorecards:
- Update KPIs on the correct frequency
- Keep data accurate and timely
- Review Scorecards regularly in meetings
Consistency creates clarity across the team.
The bottom line
Scorecards are not just for viewing performance.
They are a system for understanding results, guiding conversations, and taking action.
What’s next
Scorecards help teams see performance clearly.
The next step is turning insight into action.
Next, explore Work Plans to learn how goals and tasks help teams move forward.